02 / Selected work / analysis system
SmartChart
A production, rule-based technical-analysis workspace for Indonesian equities.
Context / problem
Reliable analysis starts before the chart
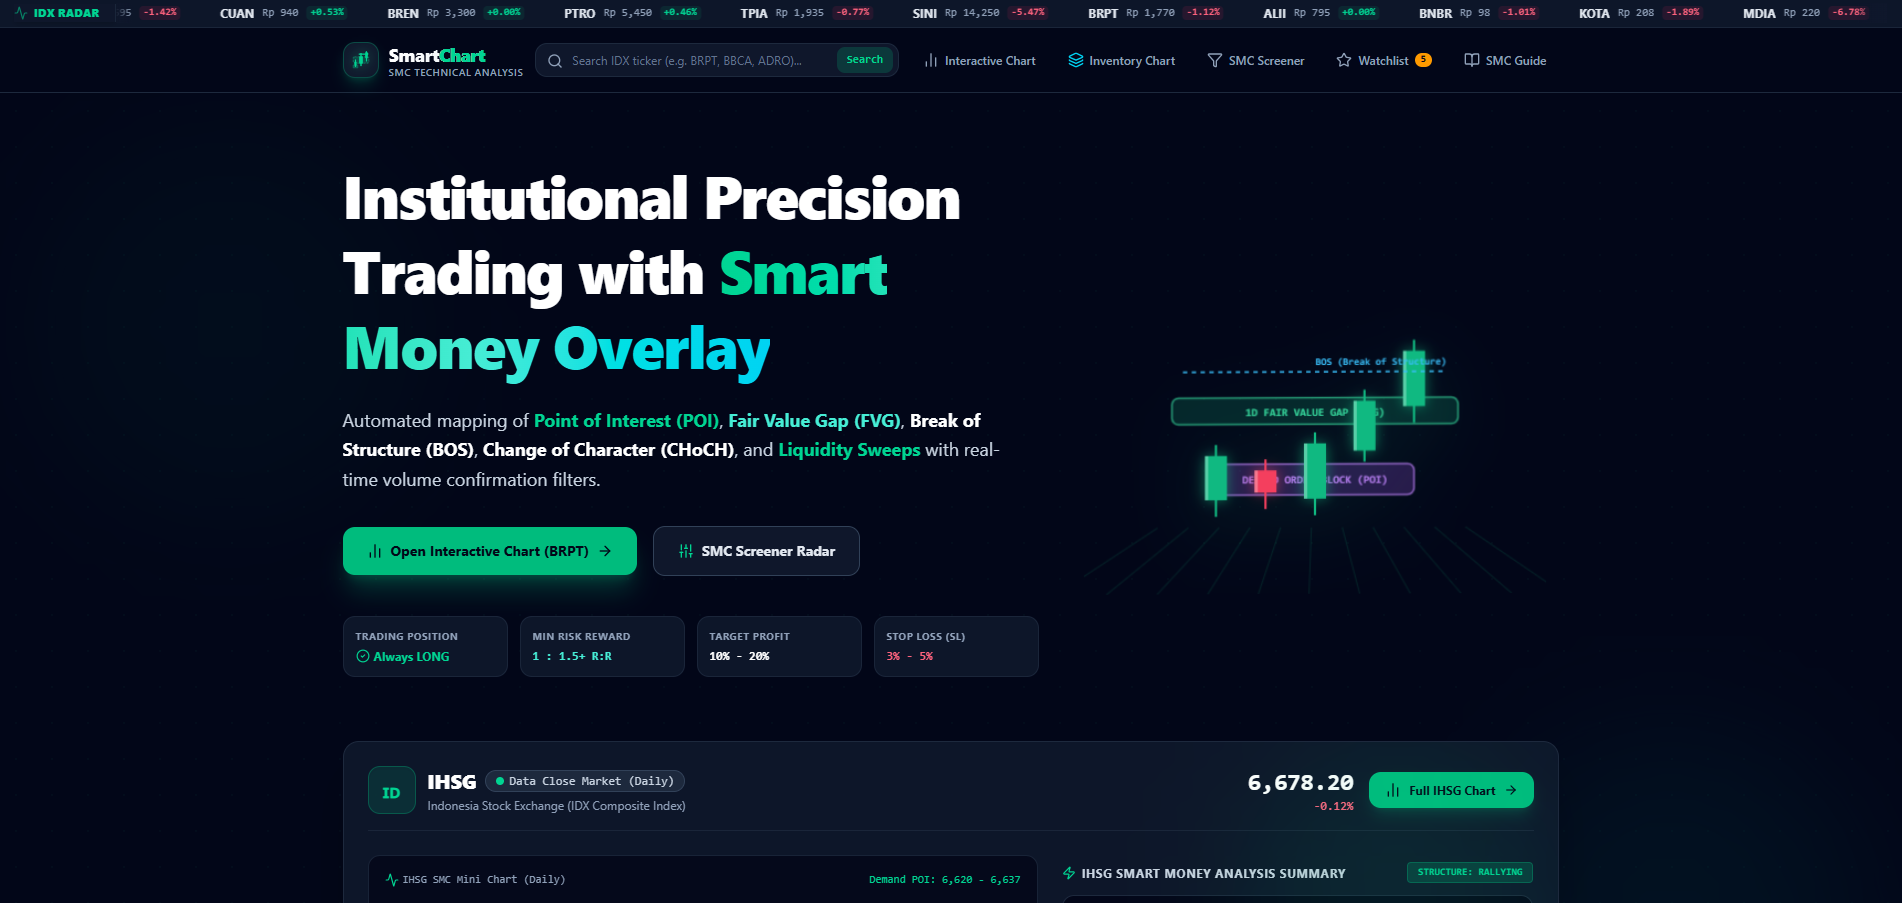
SmartChart is a production, rule-based technical-analysis workspace for Indonesian equities. I built the application end-to-end across the frontend, backend, data-processing flow, analysis experience and deployment.
Market data requires normalization and reliable processing before it can be used consistently for analysis.
System decision
Keep upstream uncertainty away from analysis
The application separates upstream data acquisition from normalized application data, then passes that data through deterministic, rule-based analysis and detection before visualization. This keeps analysis from being tightly coupled to one upstream representation.
Repository-backed caching, synchronization and fallback paths help keep that processing flow usable when upstream data is delayed or unavailable.
Primary analysis surface
A broad view of the working system
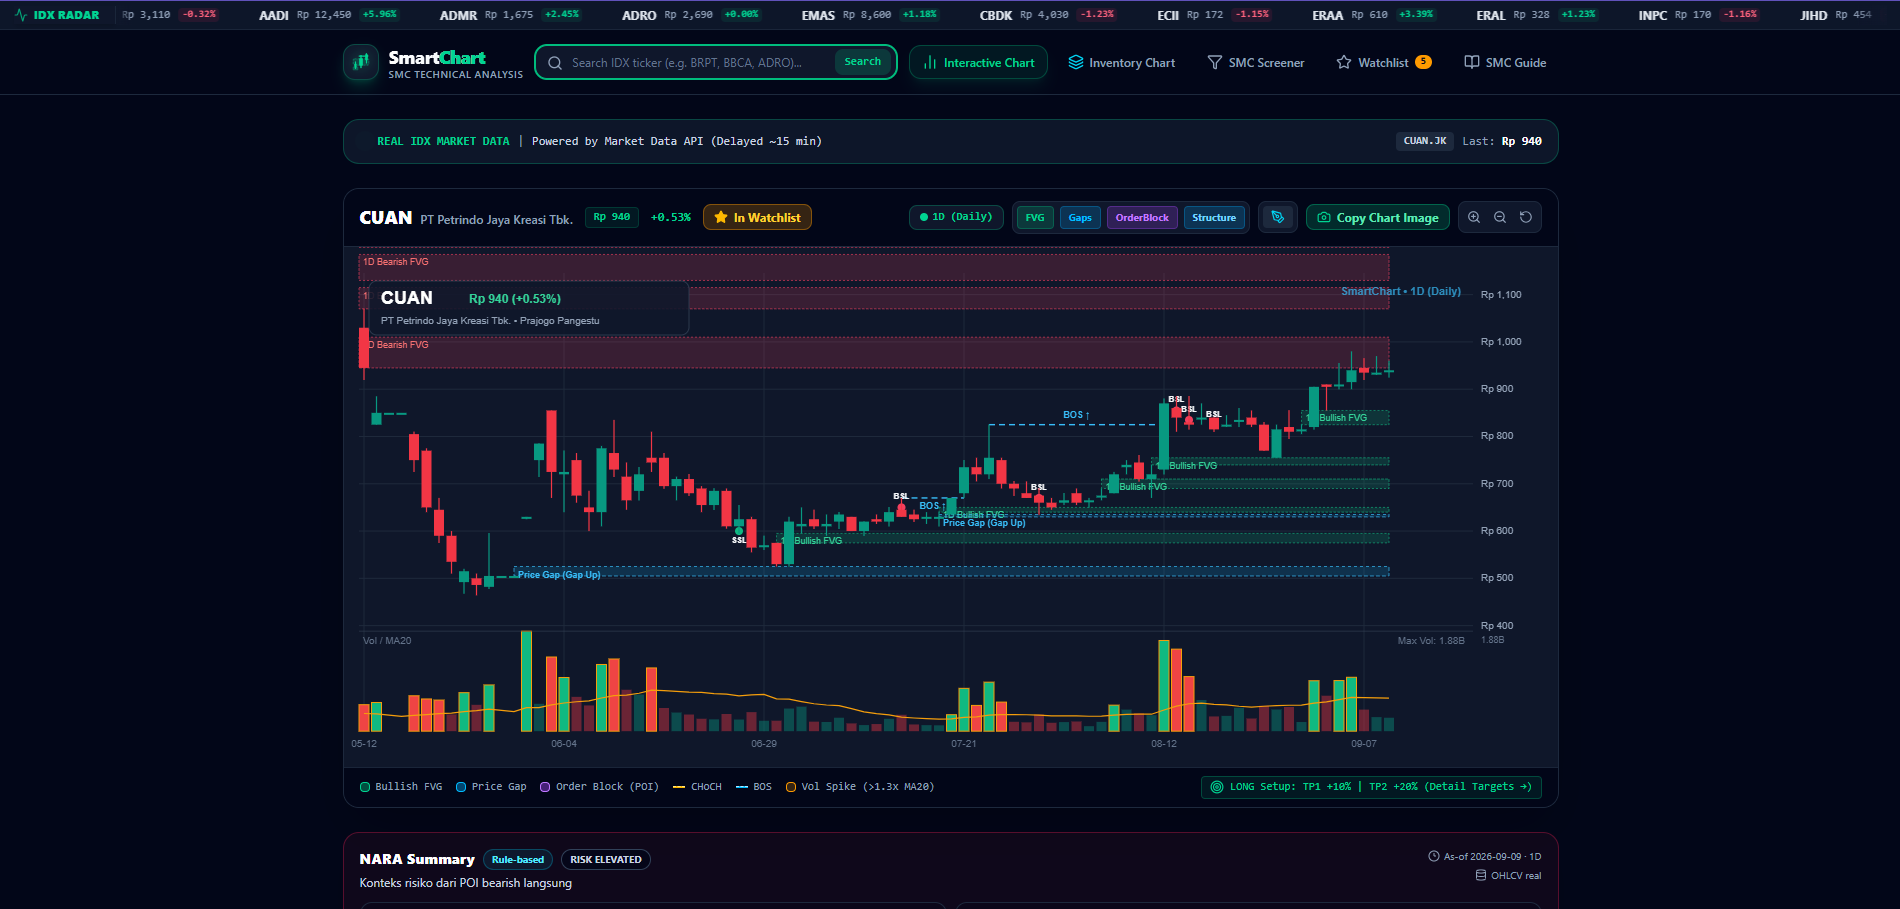
The CUAN analysis view is the primary visual record of the product: market-structure overlays, candlesticks and volume remain legible as one working surface.
Data flow / boundaries
Verified system scope
- Rule-based market-pattern detection and decision-support signals
- Stock screening, watchlists and position sizing
- Broker-inventory data views
- Interactive canvas-based chart surfaces
Secondary workflow
Inventory as another analysis context
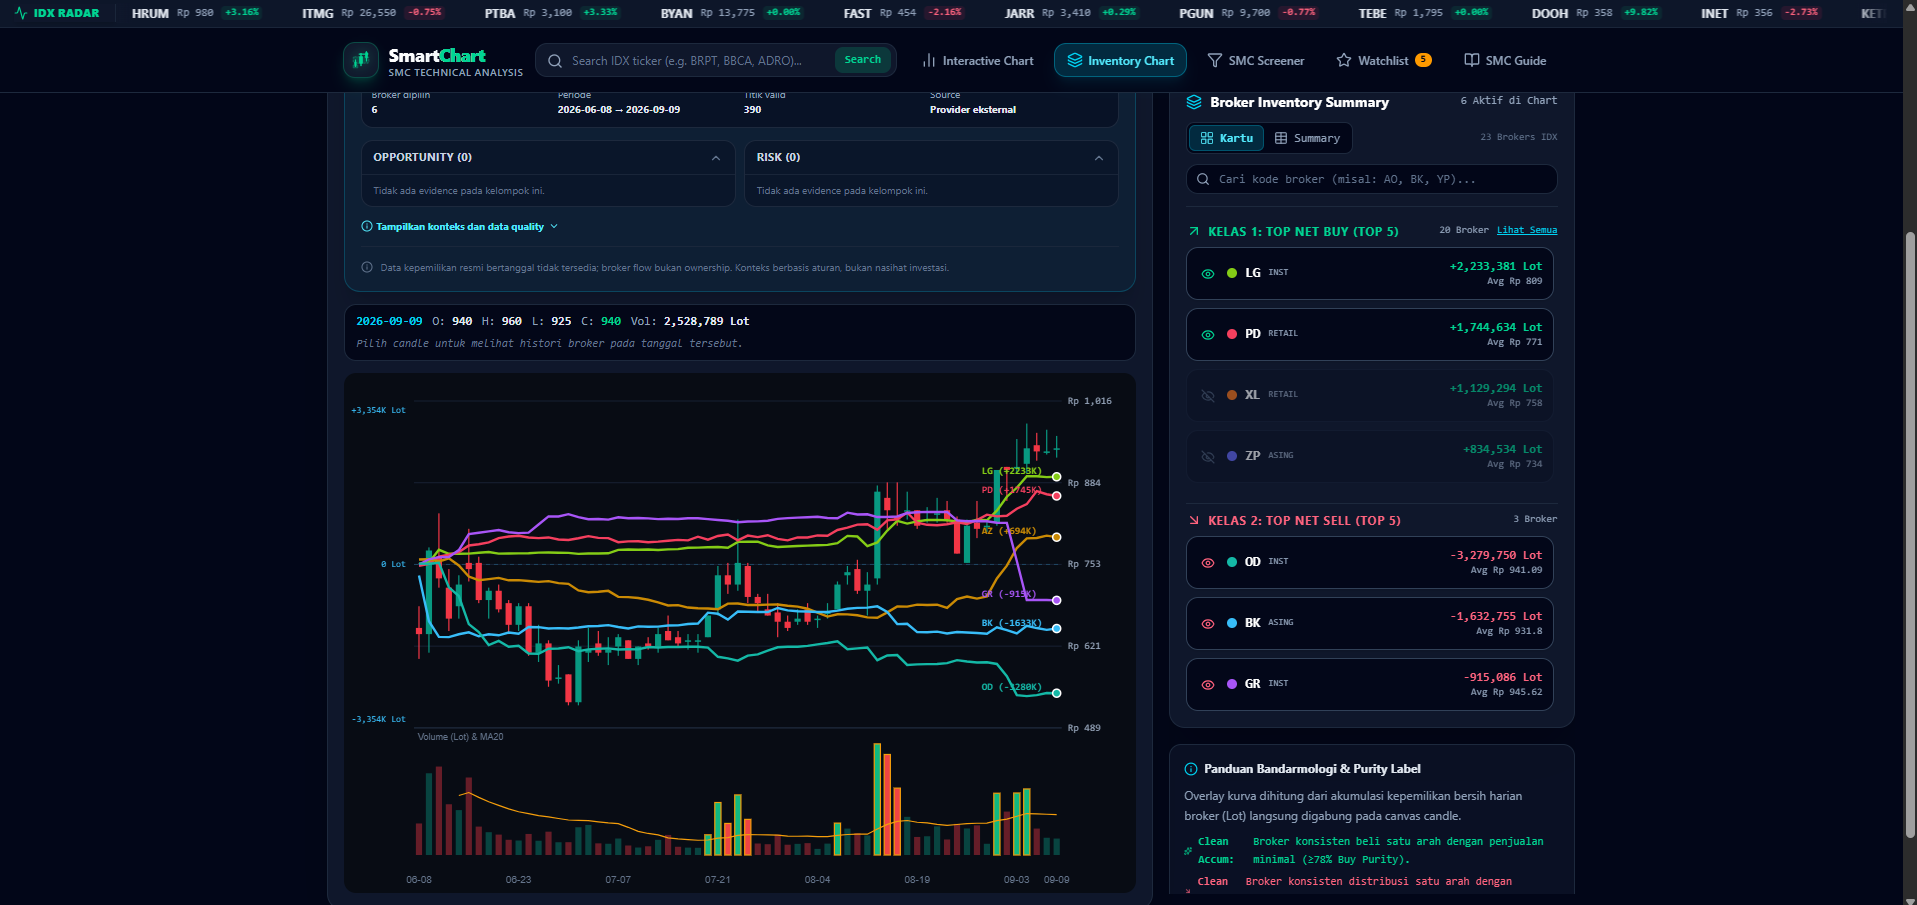
The broker-inventory view keeps a related data workflow visible without turning the page into a dashboard gallery.
Result / current status
Decision support from available market data
SmartChart automates market-pattern detection and produces rule-based decision-support signals from the available market data, exposing the analysis through visualizations.
The analysis is decision support, not financial advice.
Repository surface
Technology Stack
- TypeScript
- React
- Vite
- Express
- Tailwind CSS
- Three.js
- Upstash Redis
- Upstash QStash
Project actions
Continue with the project
Next project / 03
FillTheLyrics ↗A production lyric-reconstruction web game built around public Spotify playlists.